I used to make illustrations by creating planar projections of solids in the earlier version of Sketchpad, but I started each of them from scratch. Now the process is much simpler with the custom tools that were introduced with version 4 of Sketchpad. Look at some of these examples to get a feel for the tools' capabilities. For a detailed explanation of the control functions follow this link to Perspective Controls.
To use these tools in your own drawings, download the Sketchpad file Perspective Tools and save it into the folder labeled Tool Folder. This will make it available to you through the Custom Tool button on the tool bar.
Some significant changes have been made to these tools to make them compatible with GSP-5. For an explanation of these changes, see GSP-5 Issues.
![]() Perspective_Tools.gsp This was last updated on June 6, 2010.
Perspective_Tools.gsp This was last updated on June 6, 2010.
![]() Solid_Tools.gsp This is an add-on collection of tools for solid images. They do not stand alone. Some of the setup tools from Perspective_Tools are required. See the documentation and tutorial on the Perspective Solids link. This was last updated on June 6, 2010.
Solid_Tools.gsp This is an add-on collection of tools for solid images. They do not stand alone. Some of the setup tools from Perspective_Tools are required. See the documentation and tutorial on the Perspective Solids link. This was last updated on June 6, 2010.
The document below has some sketches that were created with these tools. You may want to check them out first to get an idea about the capabilities of the tools.
Begin by selecting the tool Perspective Setup. Select or create four points in this order: x-y center, z center, image center, and dial. The points can be anywhere on the screen. They can be free points, or they can be constrained by some construction. The point labels do not matter. The setup tool will construct hidden points beneath them. Below is an explanation of the function of each of these points.
x-y center - This is the origin of the x-y plane, viewed from above. The x and y coordinates of a pre-image point are determined by a point's position in relation to this point.
z center - This is a reference point for the z coordinate of the pre-image.
image center - This is the point of the image that corresponds to the origin of the pre-image.
dial - This is the axis of the dial that controls the rotations.
As soon as the setup is complete, click the "Initialize" button to set the positions of some of the objects. This button will not be needed again. It can now be hidden.
The setup tool takes care of all of the assumed inputs. To transform a point, only two objects need to be selected. The first is the horizontal position of the point with respect to the point x-y center. The second is the vertical position with respect to the point z center.
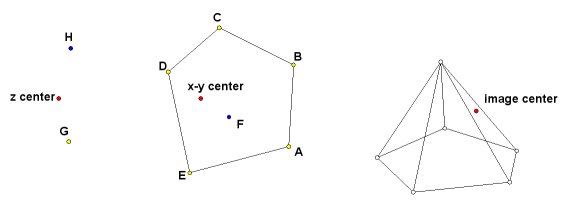
Try this simple construction. It is an irregular pyramid. The labels are shown for the reference illustrations. They do not have to have these names. In fact, on certain constructions there can be conflicts if they are given these names. Construct the base ABCDE near the x-y center. Point F is the horizontal location of the apex. Points G and H will determine the heights of the base and the apex. Select the Point tool and select these points in order:
A, G
B, G
C, G
D, G
E, G
The second point is the same for each entry because all of the base points lie in a horizontal plane at a height determined by point G. If you followed that sequence correctly, five white points will have been drawn near image center. Connect them with line segments. Now use the Point tool again to plot the apex.
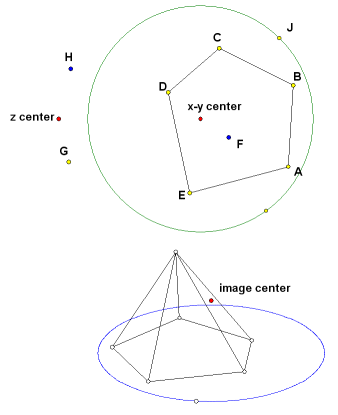
F, H
Use line segments to connect the image of the apex to the images of the five base points. Experiment with the controls and see how they affect the image. It is still possible to change the shape of the base and the two points that control the heights. The image will change with them.
Now try a locus. It is easy enough to draw a circle in the x-y plane, but in the perspective view it will appear as an ellipse. First draw a circle using x-y center as the circle center. Construct point J on the circle. Use the Point tool to construct its image at the same height as the base.
J, G
Select point J and the new image point and construct the locus. It will be an ellipse.
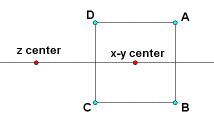
The point z center may be anywhere on the screen. It may even be hidden. Heights of points are measured with respect to z center, but the reference points do not have to be directly above or below it. Often it is convenient to place z center on a horizontal line through x-y center. That way we can benefit from the symmetry of certain solids, such as the cube.
It is assumed that if you have come this far, you know enough about Sketchpad to do certain intermediate level constructions. Construct a horizontal line with two points on it. Use the Perspective Setup tool. Designate the right point as x-y center and the left point as z center. Construct square ABCD with horizontal and vertical sides and centered on x-y center.
If the cube is to be centered on the origin, then these four points can be used not only for the horizontal location, but also for the vertical. The height of the top vertices of the cube will be the same as the height of point A above z center. The bottom vertices will have the height of point B. Here is the selection sequence for drawing the eight vertices of the cube with the Point tool:
A, A
B, A
C, A
D, A
A, B
B, B
C, B
D, B
Now draw the edges by connecting the vertices with line segments. Having eight disconnected points on the screen can be confusing because it is difficult to tell which are in front and which are in back. It may be helpful to use the spin control to move them. The points will be move about a vertical axis in the same direction as the spin control is turning. When plotting more complex images, it is a good idea periodically to stop plotting points and do parts of the line work.
This might be a good time to play around with the controls. Look at it in Perspective view. It is the most life-like. The images of opposite faces will not be congruent and parallel edges will point toward a common vanishing point. This is because different parts of the cube are projected at different scales, depending on their distance from the observer.

Now click on the Orthogonal Projection button. After it shifts, all of the parallel edges will be projected with the same scale. In the case of the cube, that means that their images will be congruent, making it impossible to distinguish the near edges from the far edges.
The Isometric Projection view is an orthogonal projection with the image rotated into such a position that any distances measured parallel to the x, y, or z-axis will have the same scale. If you ever had a traditional drafting class, you probably learned to do this with a T-square and a 30-60-90 triangle. It is quite effective for showing dimensions, but this example shows some of the shortcomings. It can create ambiguous vertices. The cube does not even look like a cube unless you know what you want to see. It looks like a regular hexagon with three diagonals.
Most of the perspective drawings from the Whistler Alley site are constructed dynamically, as shown above, so that the position of each point is controlled by two other points. This makes it possible to manipulate the image by dragging objects on the screen. There is also a group of tools for plotting points by coordinates. In general, this method is more cumbersome, but it is also much easier to learn.
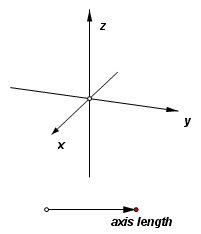
Before plotting anything, it will be necessary to execute the Perspective Setup tool as described above. It is not necessary to have coordinate axes showing, but it might help. To construct them, choose the custom tool xyz-axes. Click one time only on some open space near the top or bottom of the screen. Choose the selection arrow tool immediately in order to deactivate the tool. The axis length is set randomly, so they will probably be too short or too long for your needs. On the point that you clicked is a linesegment controlling the length of the axes. Drag the red point to control the length. There will also be a new hide/show button for the axes.
In Preferences set the distance unit to centimeters. Next, from the Graph menu, choose New Parameter. Define these three parameters:
x = 2 cm
y = 3 cm
z = –1 cm
Here the point (2, 3, –1) is plotted using the image center point as the origin. Experiment with changing the coordinates and the viewing perspective.
In the following example, an octahedron will be plotted, with all six vertices at a unit distance from the image center. This way, only three numbers will be required for the coordinates. Hide or delete the previously plotted point. From the Graph menu, choose New Parameter. Define these three parameters:
t1 = 1 cm
t2 = 0 cm
t3 = –1 cm
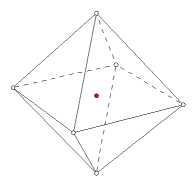
Choose the custom tool Plot (x,y,z). Click in order on the parameters t1, t2, t2. Notice that t2 is used twice in a row. After clicking it the first time, it will no longer be highlighted. Drag the cursor off of the number and then back before making the last click. The point (1, 0, 0) is plotted. Using the same three parameters, plot the remaining vertices and connect them with line segments. Here are the coordinates of all six vertices, beginning with the one that was just plotted:
(1, 0, 0)
(-1, 0, 0)
(0, 1, 0)
(0, -1, 0)
(0, 0, 1)
(0, 0, -1)
It is easy to get the coordinates in the wrong order, especially if a large group of points is being plotted. To avoid this, keep an eye on the prompt that appears on the status bar. It will indicate the name of the next coordinate required.
Use the Plot (x,y,z) tool to plot by rectangular coordinates. Two other coordinate plotting tools are available: Plot (r,theta,z) for cylindrical coordinates, and Plot (rho,theta,phi) for spherical coordinates.
The distance units will be consistent near the origin, but they are subject to the scale control. The coordinates may be defined by parameters, measurements or calculations. If the coordinate has no dimension or an incorrect dimension (e.g., an angle where a distance is required), then the point will still be plotted, but the units of the coordinate will be set by the corresponding unit in the Preferences. Of course, all of these points will be projected onto the plane of the screen, so accurate distance and angle measurements will not be possible.
For a look at some related topics, see the links below:
Back to the Sketchpad Workshop
Back to Whistler Alley Mathematics