Geometer’s Sketchpad demo — If you do not have Sketchpad, you can download a demo here.
Handcuff.gsp — Download this Geometer's Sketchpad file.
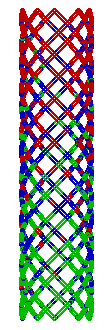
The sketch gets this name because it resembles a little bauble I used to see handed out as a prize at carnivals. We used to call them Chinese handcuffs, but they may have had other names in various regions. It is an open cylindrical object, made from woven rushes. If you stick a finger into each end and try to pull them apart, it will squeeze the fingers, preventing them from separating.
Rather than lead anyone around by the nose, I think it might be more interesting to let the students do their own investigations. There are applications for geometry, trigonometry, and probability. It does not look like much when you first open the file, just one point and three buttons. Leave the “Hide” and “Show” buttons alone to begin with. Just double-click the “Animate” button and watch the show.
Does the trace path resemble the graph of a familiar function?
Can you guess how it was constructed?
Imagine that the pattern is three-dimensional, a continuous curve painted on a cylinder. If you ignore the color changes, how many symmetries does the figure have?
After a while, the pattern repeats, but the colors keep changing. Why?
What can you infer about the distributions of the three colors?
Does one color dominate any region?
Is any color more prevalent overall?
Now hit the "Show" button and look under the hood. Animate the sketch again. There are two labeled control points. See what happens when you move them. Experiment.
Was your answer to the first question correct?
What condition determines the color of the trace point?
The point on the circle and the point on the black vertical line segment are moving at the same speed. What is the ratio of the circle’s circumference to the length of the segment?
If you know the vertical coordinate of the trace point, and the length of vertical interval over which it travels, what is the probability that the point is red (blue, green)?
Can you graphically represent that probability as a ratio of areas?
What expected fraction of the total figure is red (blue, green)?
When I first put this page up, I did not intend to offer any solutions. Since then I wrote up some investigations into those probability questions. You can read about it here.
Back to Whistler Alley Mathematics