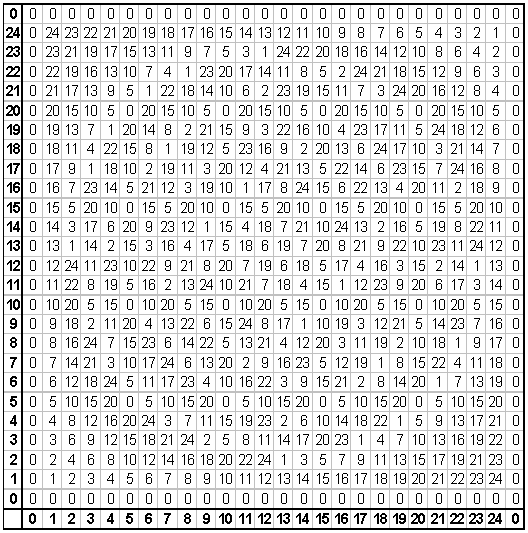
This investigation requires some knowledge of modular arithmetic and congruence classes. Some elementary principles will be reviewed here, but a more thorough understanding will have to come from other sources.
Given an integer n, integers a and b are congruent modulo n, if and only if n divides (a-b). Equivalently, when a and b are divided by n, both leave the same least nonnegative integer remainder.
The congruence class of a modulo n (denoted [a]) is the set of all integers congruent to a. That is, if a and b are congruent modulo n, then they belong to the same congruence class, so [a] = [b]. There are n distinct congruence classes modulo n, usually denoted by there least nonnegative element: [0], [1], ... , [n-1]. The set of all congruence classes modulo n is denoted Zn. Some useful properties of modular arithmetic:
[a] + [b] = [b] + [a] = [a + b]
[a][b] = [b][a] = [ab]
This idea began in a linear algebra class. The professor was handing out copies of multiplication tables in Z25. I saw nothing remarkable about my copy, but the page in the professor's hand looked completely different. In fact, it was identical, but the numbers in his copy seemed to form a circular pattern. He was standing about ten feet away from me, and it was more noticeable from a distance. Do you see the ring patterns in this table? If not, try looking at it from a distance, or squint your eyes.

You may have noticed that the indices of this table, contrary to convention, increase from the lower left rather than the upper left. And the zero index was represented twice on each axis. One reason for this was so that it would be easier to see the symmetries. If you examine the table closely, you will see that it has reflection symmetry on both of the diagonals.
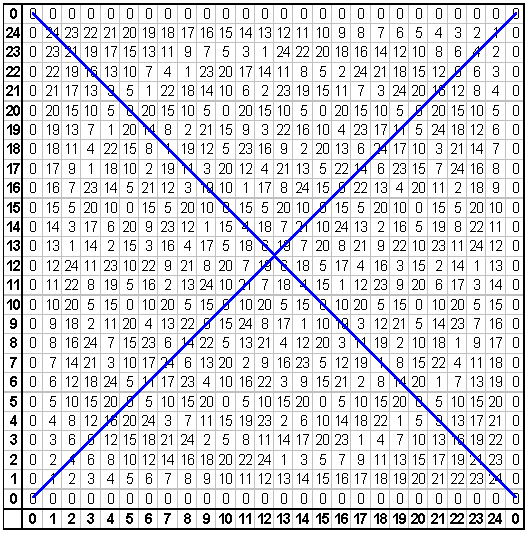
Let a represent the index corresponding to the horizontal axis, and let b represent the vertical index. Each cell may be given coordinates (a,b), and the cell's contents are [a][b]. It should be easy to see why the table is reflected on the diagonal that intersects the lower left corner. When (a,b) is reflected on that line, its image is (b,a), and the value of its image is [b][a]. Modular multiplication is commutative, so [a][b] = [b][a].
What about the other diagonal? The image of (a,b), reflected on the second diagonal is (25-b,25-a), and its value is [25-b][25- a]. Why is that equal to [a][b]? Note that 25 - 0 = 25, which is divisible by 25, so 25 and 0 are congruent modulo 25.
[25-a] = [25-a-0] = [25-a] - [0] = [25-a] - [25] = [25- a-25] = [-a]
By the same reasoning, [25-b] = [-b]
Therefore, [25-b][25-a] = [-b][-a] = [(-b)(- a)] = [ba] = [ab] = [a][b]
The reflections are simple enough to explain, but what about the circle patterns? We see the patterns because, at a distance, some numerals appear lighter than others. Specifically, the single-digit numerals are lighter than the two-digit numerals. Let's modify the chart. All numbers less than 10 will be replaced by a capital "O." All other numbers will be replaced by a space. This way we should see the same pattern, but with more contrast.
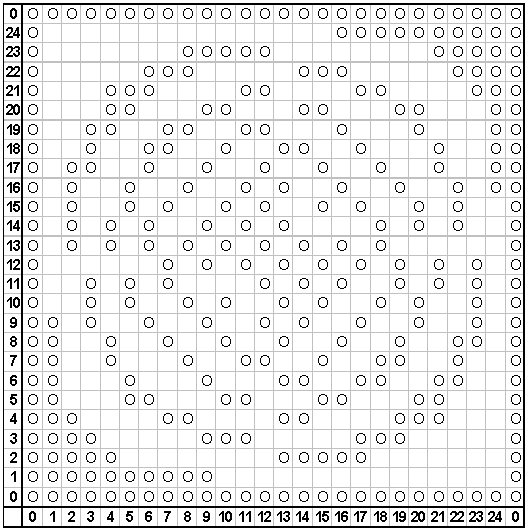
Notice that the lower left corner has a cluster of marks because of the small numbers. In fact, the entire left column has marks, because those cells all have a value of zero. Pick any row, and follow it from left to right. It will not have a blank space until the cell has a value of 10 or more. We cannot always isolate the spot where its value reaches 10, because we are working with a discrete set. For instance, follow the row (a,3). It goes from (3,3), with a value of 9, to (4,3), which has a value of 12. It skips 10 altogether.
To get around this problem, superimpose the x-y Cartesian plane over the table. The origin is at the center of cell (0,0). At the center of each cell, (a,b) = (x,y). Now we can say that, moving from left to right, the first blank cell can only occur after we cross the curve xy = 10, a hyperbola. Continuing in that same direction, the first marked cell occurs after we cross another hyperbola, xy = 25 (remember, [25] = [0]). And then the next blank is after xy = 35 (because [35] = [10]). These curves are plotted over the table in the image below. Notice how the marks are nested into them.
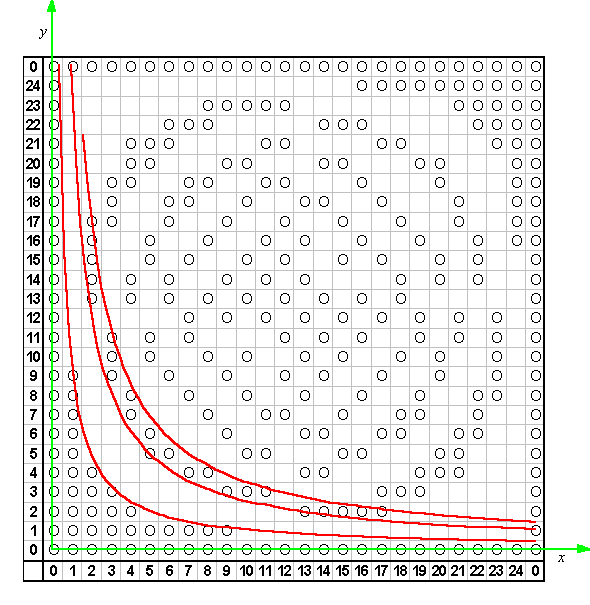
Now try looking at it another way. Once again, we are looking for a continuous curve such that (a,b) would fall on the curve if [a][b] = [10]. But look what we can do with that equation:
[a][b] = [10]
[a-25][b] = [10]
[a-25][b] = [-15]
(x-25)y = -15
(25-x)y = 15
This curve has a different look than the others. Use this method to show that there will be boundaries on the hyperbolas (25-x)y = 25, and (25-x)y = 40. What would be the next equations in this sequence? These first three curves are plotted here:
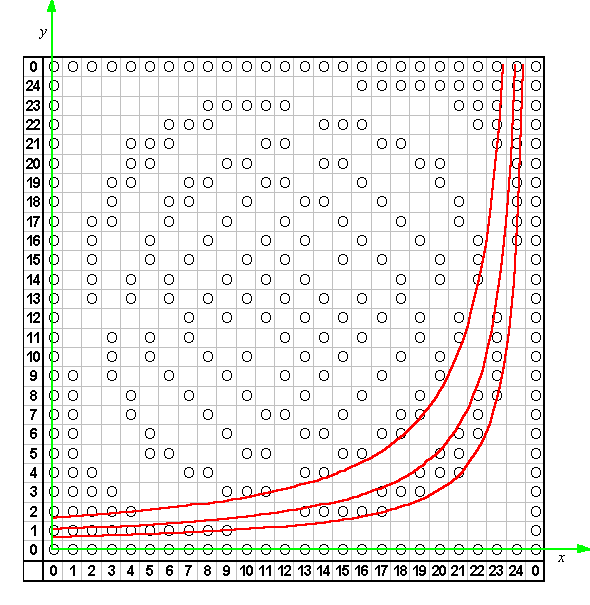
Remember the diagonal reflections? The chart has symmetry on both diagonals, so it must be possible to reflect these hyperbolas and retain the same properties. Each of the hyperbolas is already symmetrical about one of the diagonals, but it may be reflected across the other. We have defined six curves so far. After reflecting each of them, we will have twelve:
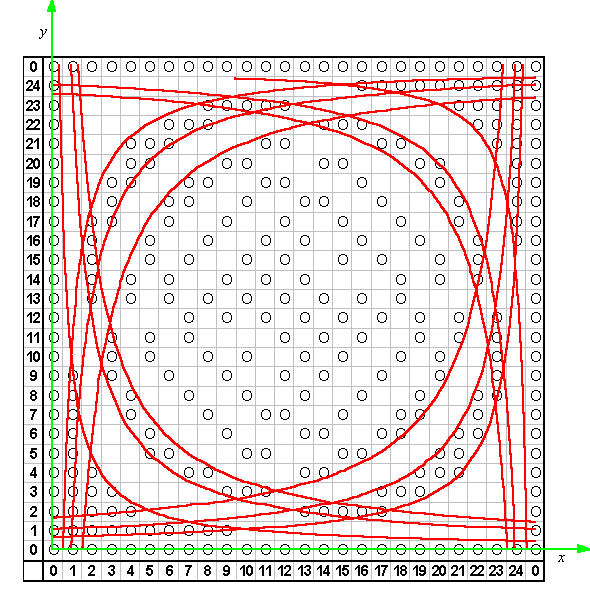
Now it is taking shape. We were not seeing circles in the table at all. They were hyperbolas, which were all opening toward the center of the table.
The tables on this page were created with a spreadsheet. See if you can duplicate them. Try using a modulus other than 25. If you make the cells small enough, you should be able to create a table with modulus 100. It will be illegible, but the patterns will be even more well defined.
Only twelve hyperbolas were plotted here. Fill in some of the others. What are the equations for the reflected hyperbolas? These sketches were created by embedding a spreadsheet into a Geometer's Sketchpad file. Can you come up with a better way?
Back to Whistler Alley Mathematics